Board risk reports are one of the most important governance documents an organisation produces. They are supposed to give non-executive directors the information they need to challenge management, oversee strategy, and discharge their duties under the Companies Act, the UK Corporate Governance Code, and sector-specific regulations.
In practice, most board risk reports fail at this basic purpose. They present information in formats that are visually appealing but analytically hollow. They describe risks in language that sounds authoritative but conveys nothing actionable. And they update so slowly that by the time the board sees a risk, management has either already resolved it or it has already materialised.
This is not a design problem. It is a data problem. And it has consequences that go beyond governance aesthetics.
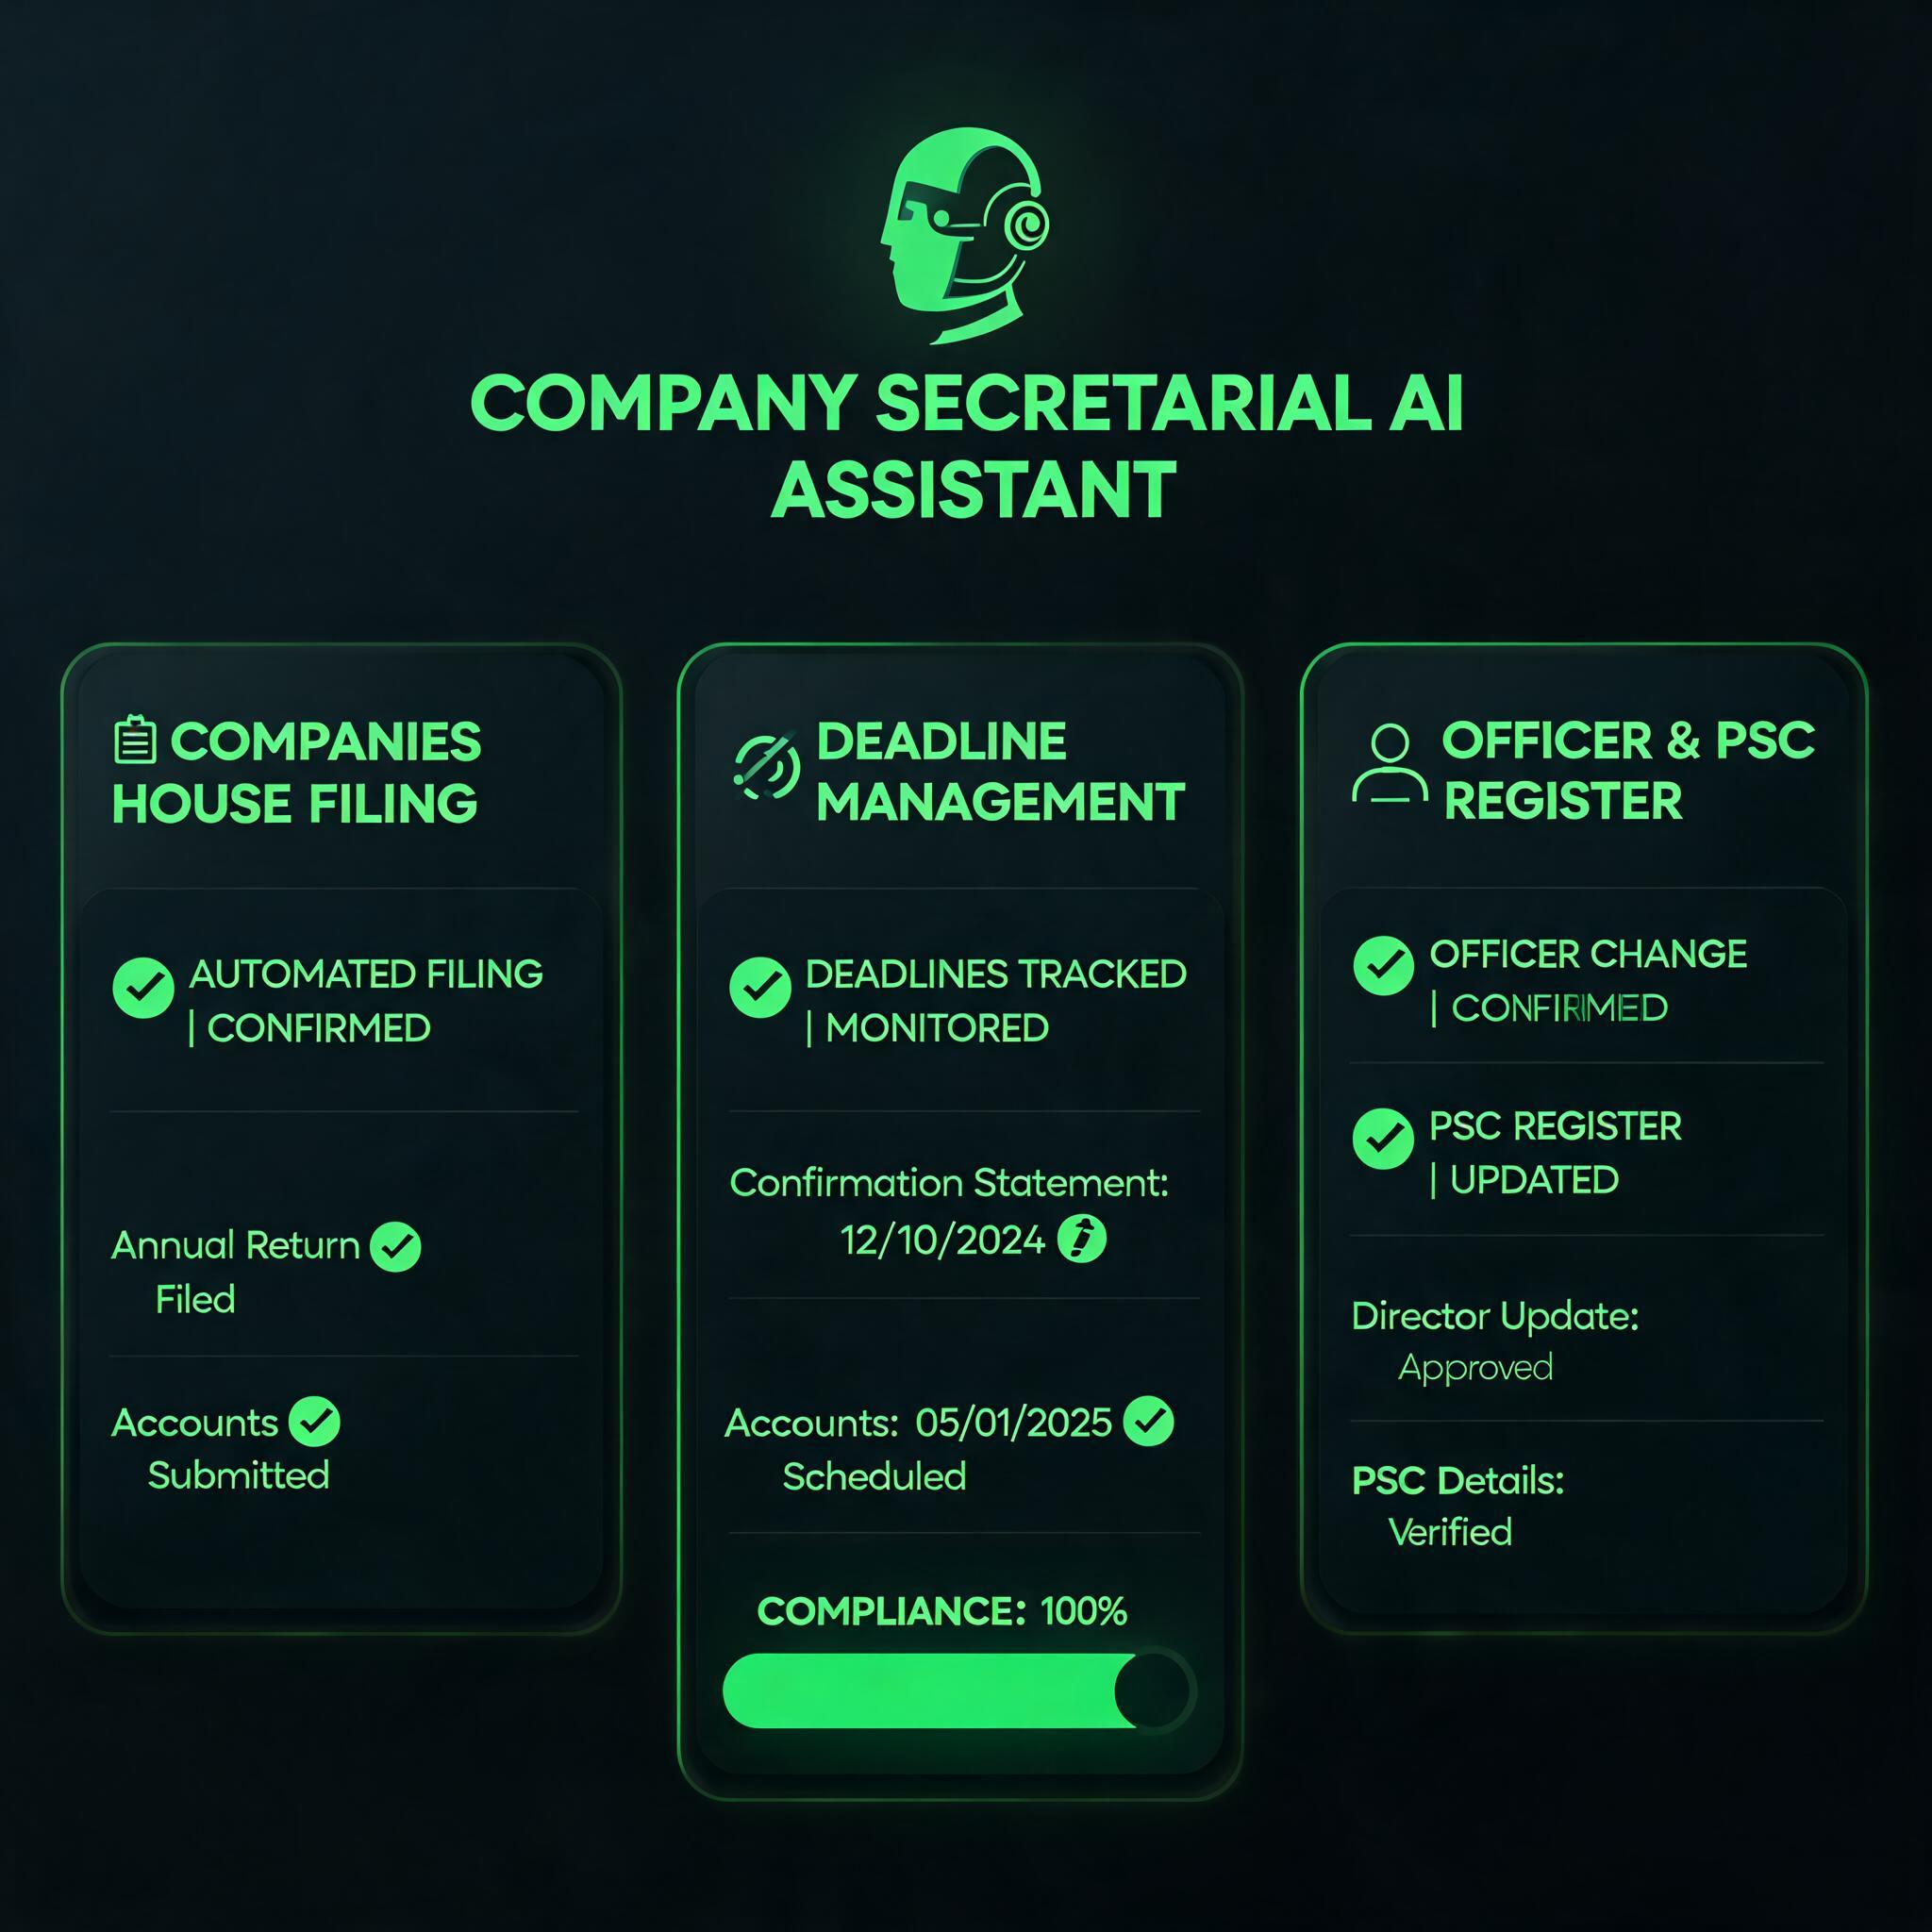
The risk heatmap is the most widely used tool in board risk reporting. A 5x5 grid with likelihood on one axis and impact on the other, colour-coded from green to red. Risks are plotted as dots. The board looks at the pattern, notes how many risks are in the red zone, and moves to the next agenda item.
The heatmap has three fundamental flaws that make it actively misleading as a governance tool:
A risk plotted at "likelihood 3, impact 4" implies a level of analytical precision that does not exist. The scores are subjective assessments made by risk owners who have different risk appetites, different assessment methodologies, and different incentives. One department head's "3" is another's "4." The result is a chart that looks quantitative but contains no reliable quantitative information.
Academic research has consistently demonstrated this problem. A 2024 study published in the Journal of Risk Research asked 200 risk professionals to assess the same set of scenarios. The standard deviation in their likelihood and impact scores was so large that the same risk could reasonably be plotted anywhere in a 3x3 range on a 5x5 grid. The heatmap does not show where risks are. It shows where risk owners put them.
A heatmap is a snapshot. It shows where risks are assessed today but nothing about where they were last quarter or where they are trending. A risk that has been at "likelihood 3, impact 4" for six quarters in a row looks identical to a risk that was at "likelihood 1, impact 2" six months ago and has been rising rapidly. The board sees the same dot in the same position and has no way to distinguish between stable and deteriorating risk profiles.
The heatmap shows assessed risk levels but nothing about the controls that produce those assessments. A risk assessed as "medium" because effective controls reduce the inherent risk to acceptable levels looks identical to a risk assessed as "medium" because the risk owner underestimates the likelihood. The board cannot distinguish between a well-controlled risk and a poorly assessed one because the heatmap strips out the control information.
The cumulative effect of these three flaws is that the heatmap gives the board a sense of oversight without providing actual oversight. Directors feel informed because they have seen a colourful chart. They are not informed because the chart contains no reliable, actionable information.
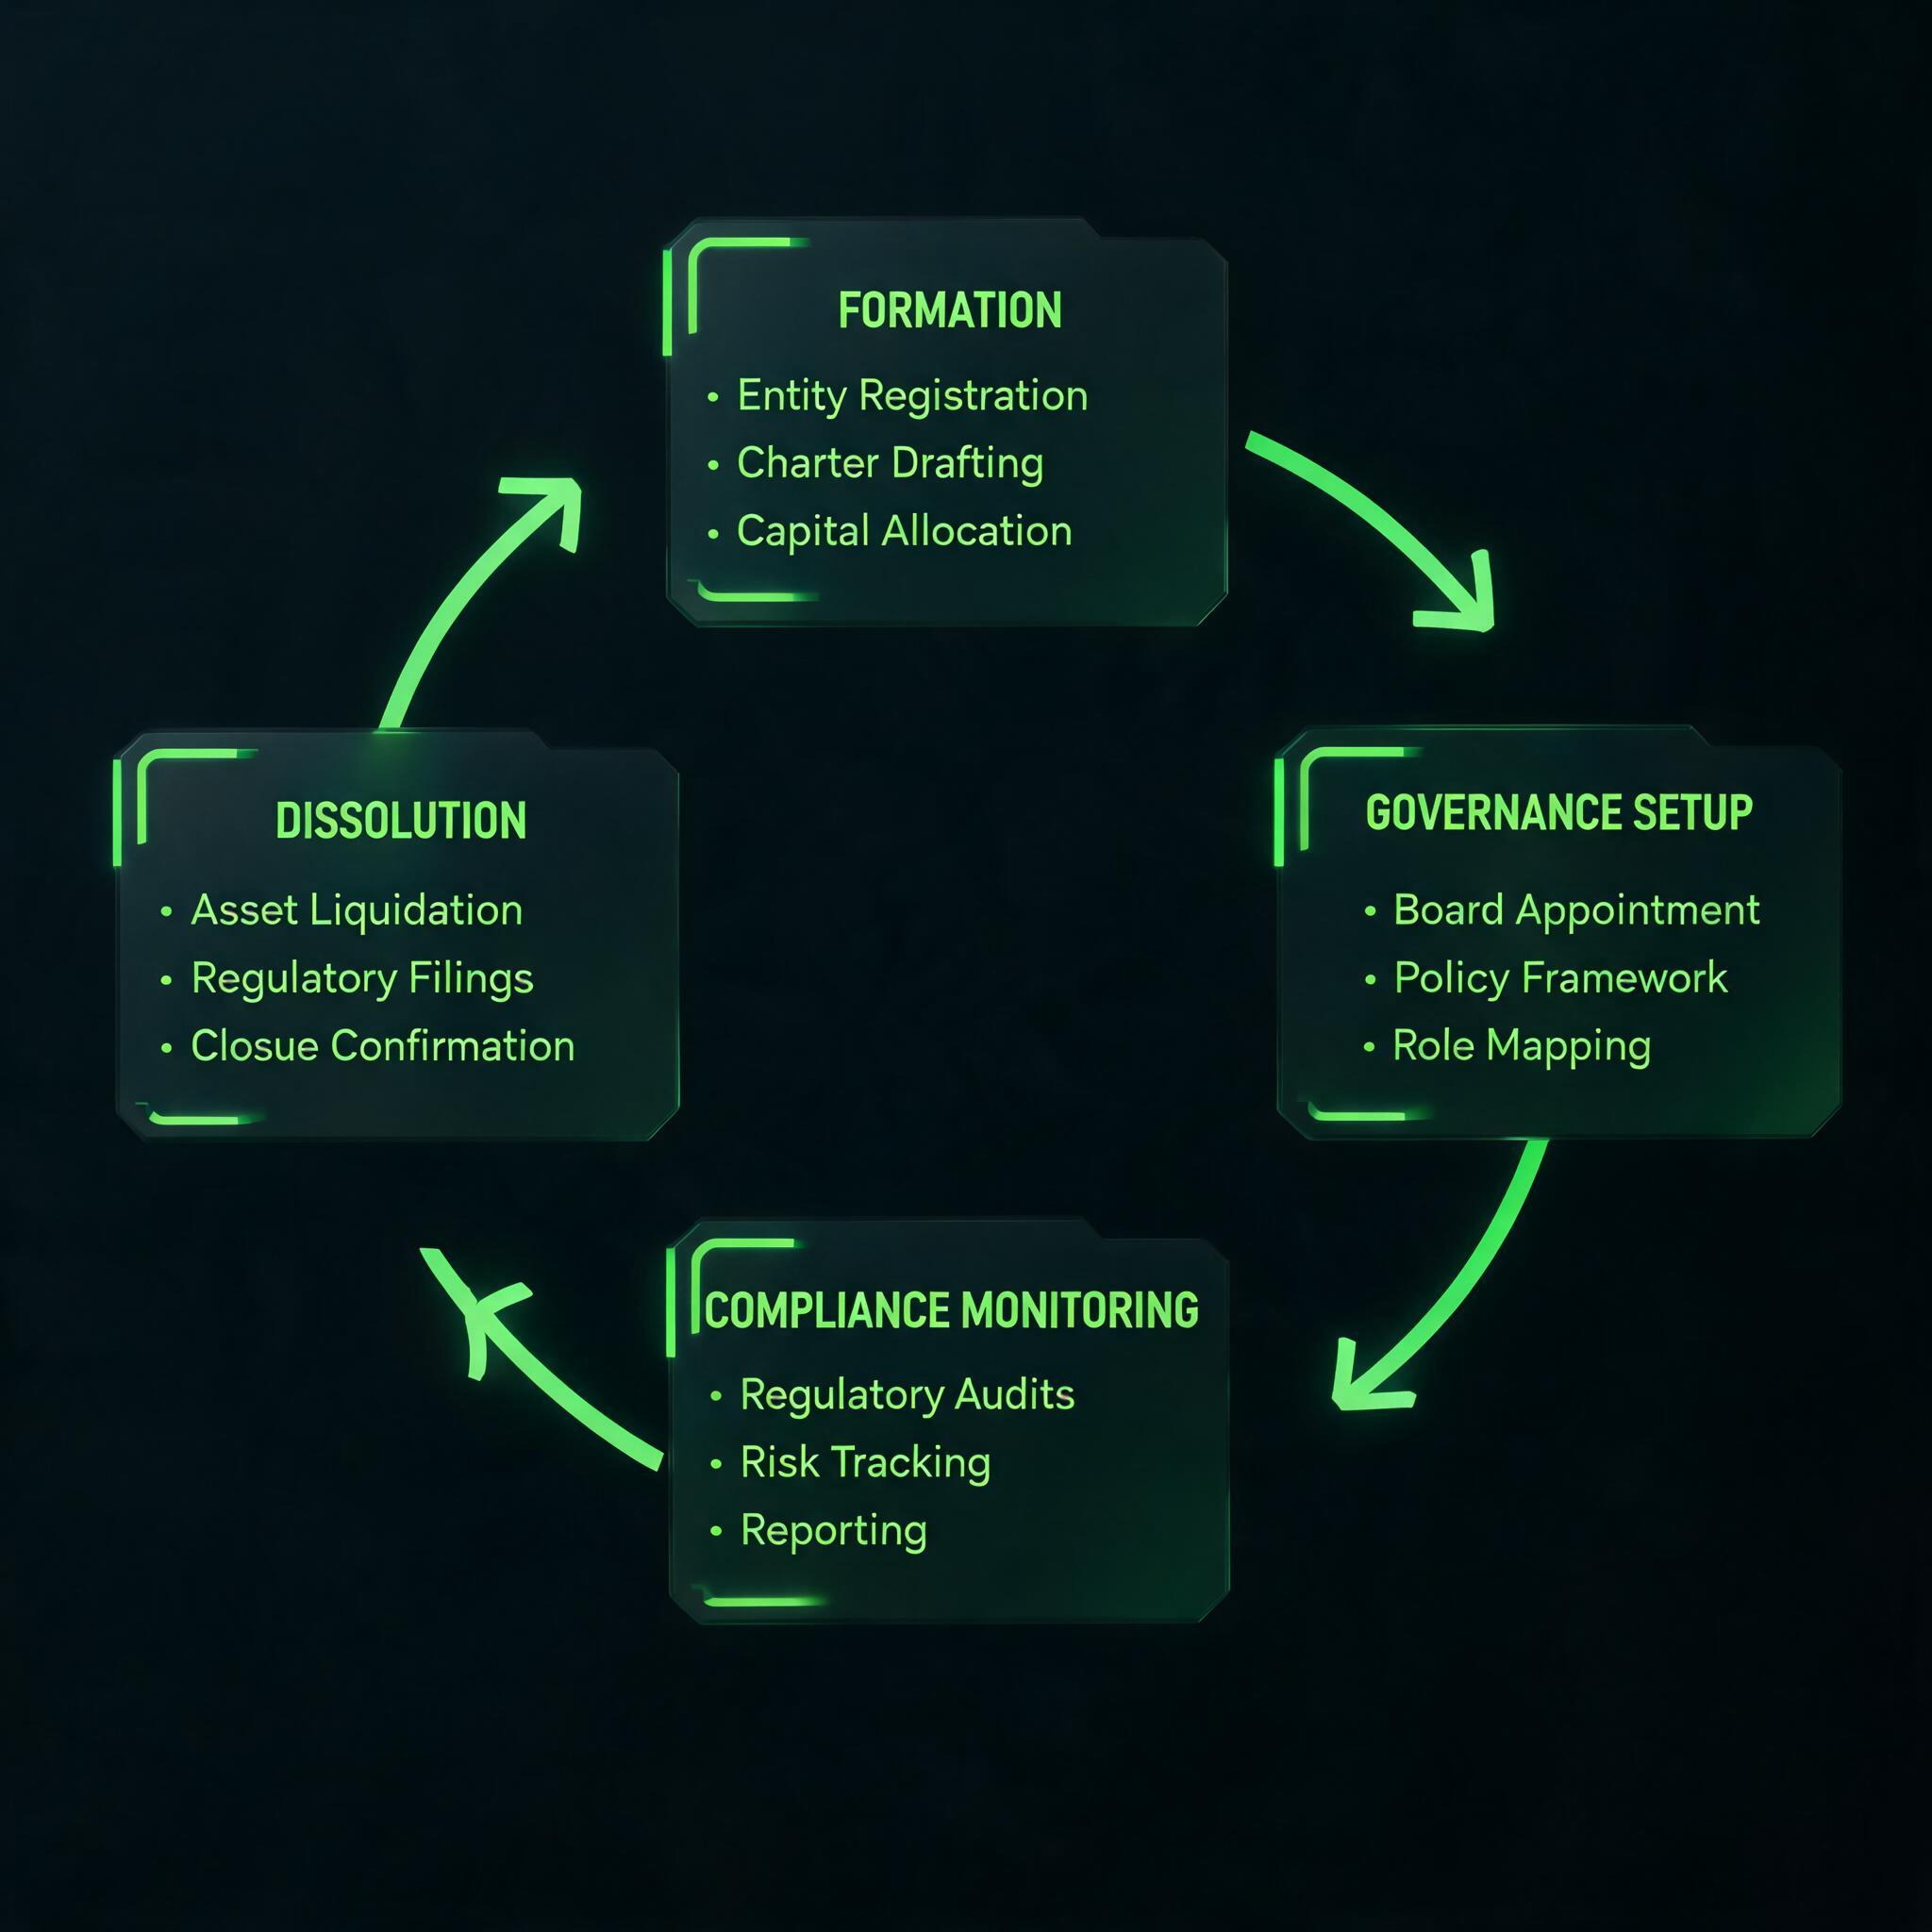
Directors do not need more data. They need better questions answered. Based on discussions with board members across multiple sectors, the questions that effective board risk reports should answer include:
1. What has changed since last quarter? Not "what is the current risk profile" but "what is different." New risks, closed risks, risks that have moved significantly, and controls that have changed in effectiveness. The board's governance value is in understanding direction and momentum, not static position.
2. What risks are connected to each other? Risks do not exist in isolation. A cyber risk event can trigger a regulatory risk, which can trigger a reputational risk, which can trigger a financial risk. The board needs to see these connections because a cluster of individually medium risks that are all connected to a single trigger is a high risk that the heatmap presents as five separate medium risks.
3. What is the evidence behind each risk assessment? When a risk is assessed as "medium," what evidence supports that assessment? Is it based on a recent control test? An incident history? A management judgment? The board should be able to trace any risk assessment back to the evidence that produced it.
4. Where is the organisation outside its risk appetite? Not where risks are on a grid, but specifically where the assessed risk level exceeds the risk appetite threshold that the board has set. This requires risk appetite to be defined at a granular level (not just "low, medium, high" for the whole organisation) and risk assessments to be measured against those thresholds.
5. What is management doing about it? For every risk outside appetite, what actions are in progress, who owns them, and what is the target completion date? The board should be able to track management's response to elevated risks across quarters and hold executives accountable for progress.
The shift from heatmaps to governance intelligence requires three architectural changes:
Risk assessments should update in response to events, not in response to a quarterly review cycle. When a control test fails, the risk assessment linked to that control should automatically reflect the change. When an incident occurs, the affected risk should be automatically reassessed. When a regulatory change is identified, the compliance risks within scope should be flagged for review.
This is not about replacing human judgment. Risk owners still make the assessment. But the system triggers the reassessment in response to events rather than waiting for the next scheduled review. The result is a risk profile that reflects current reality rather than the reality of three months ago.
Risks need to be linked to each other, to controls, to incidents, to projects, and to the governance actions that address them. This connection creates a risk graph that shows how risks interact, what controls mitigate them, and what evidence supports the assessments.
In a connected model, when the board asks "why is this risk assessed as medium?" the system can show the control test results, the incident history, the risk appetite threshold, and the management actions in progress. The risk assessment is not a number on a grid. It is a conclusion supported by traceable evidence.
The board risk report should be automatically generated from the live risk data, not manually compiled by a risk analyst over two weeks. The report should include pre-configured views that answer the board's questions: changes since last quarter, risks outside appetite, connected risk clusters, and management action status.
This does not mean the report is entirely automated. The Chief Risk Officer or equivalent should add narrative commentary that contextualises the data and highlights items that require board discussion. But the data itself, the risk positions, the control test results, the action statuses, should be pulled directly from the platform, not transcribed from spreadsheets into a presentation.
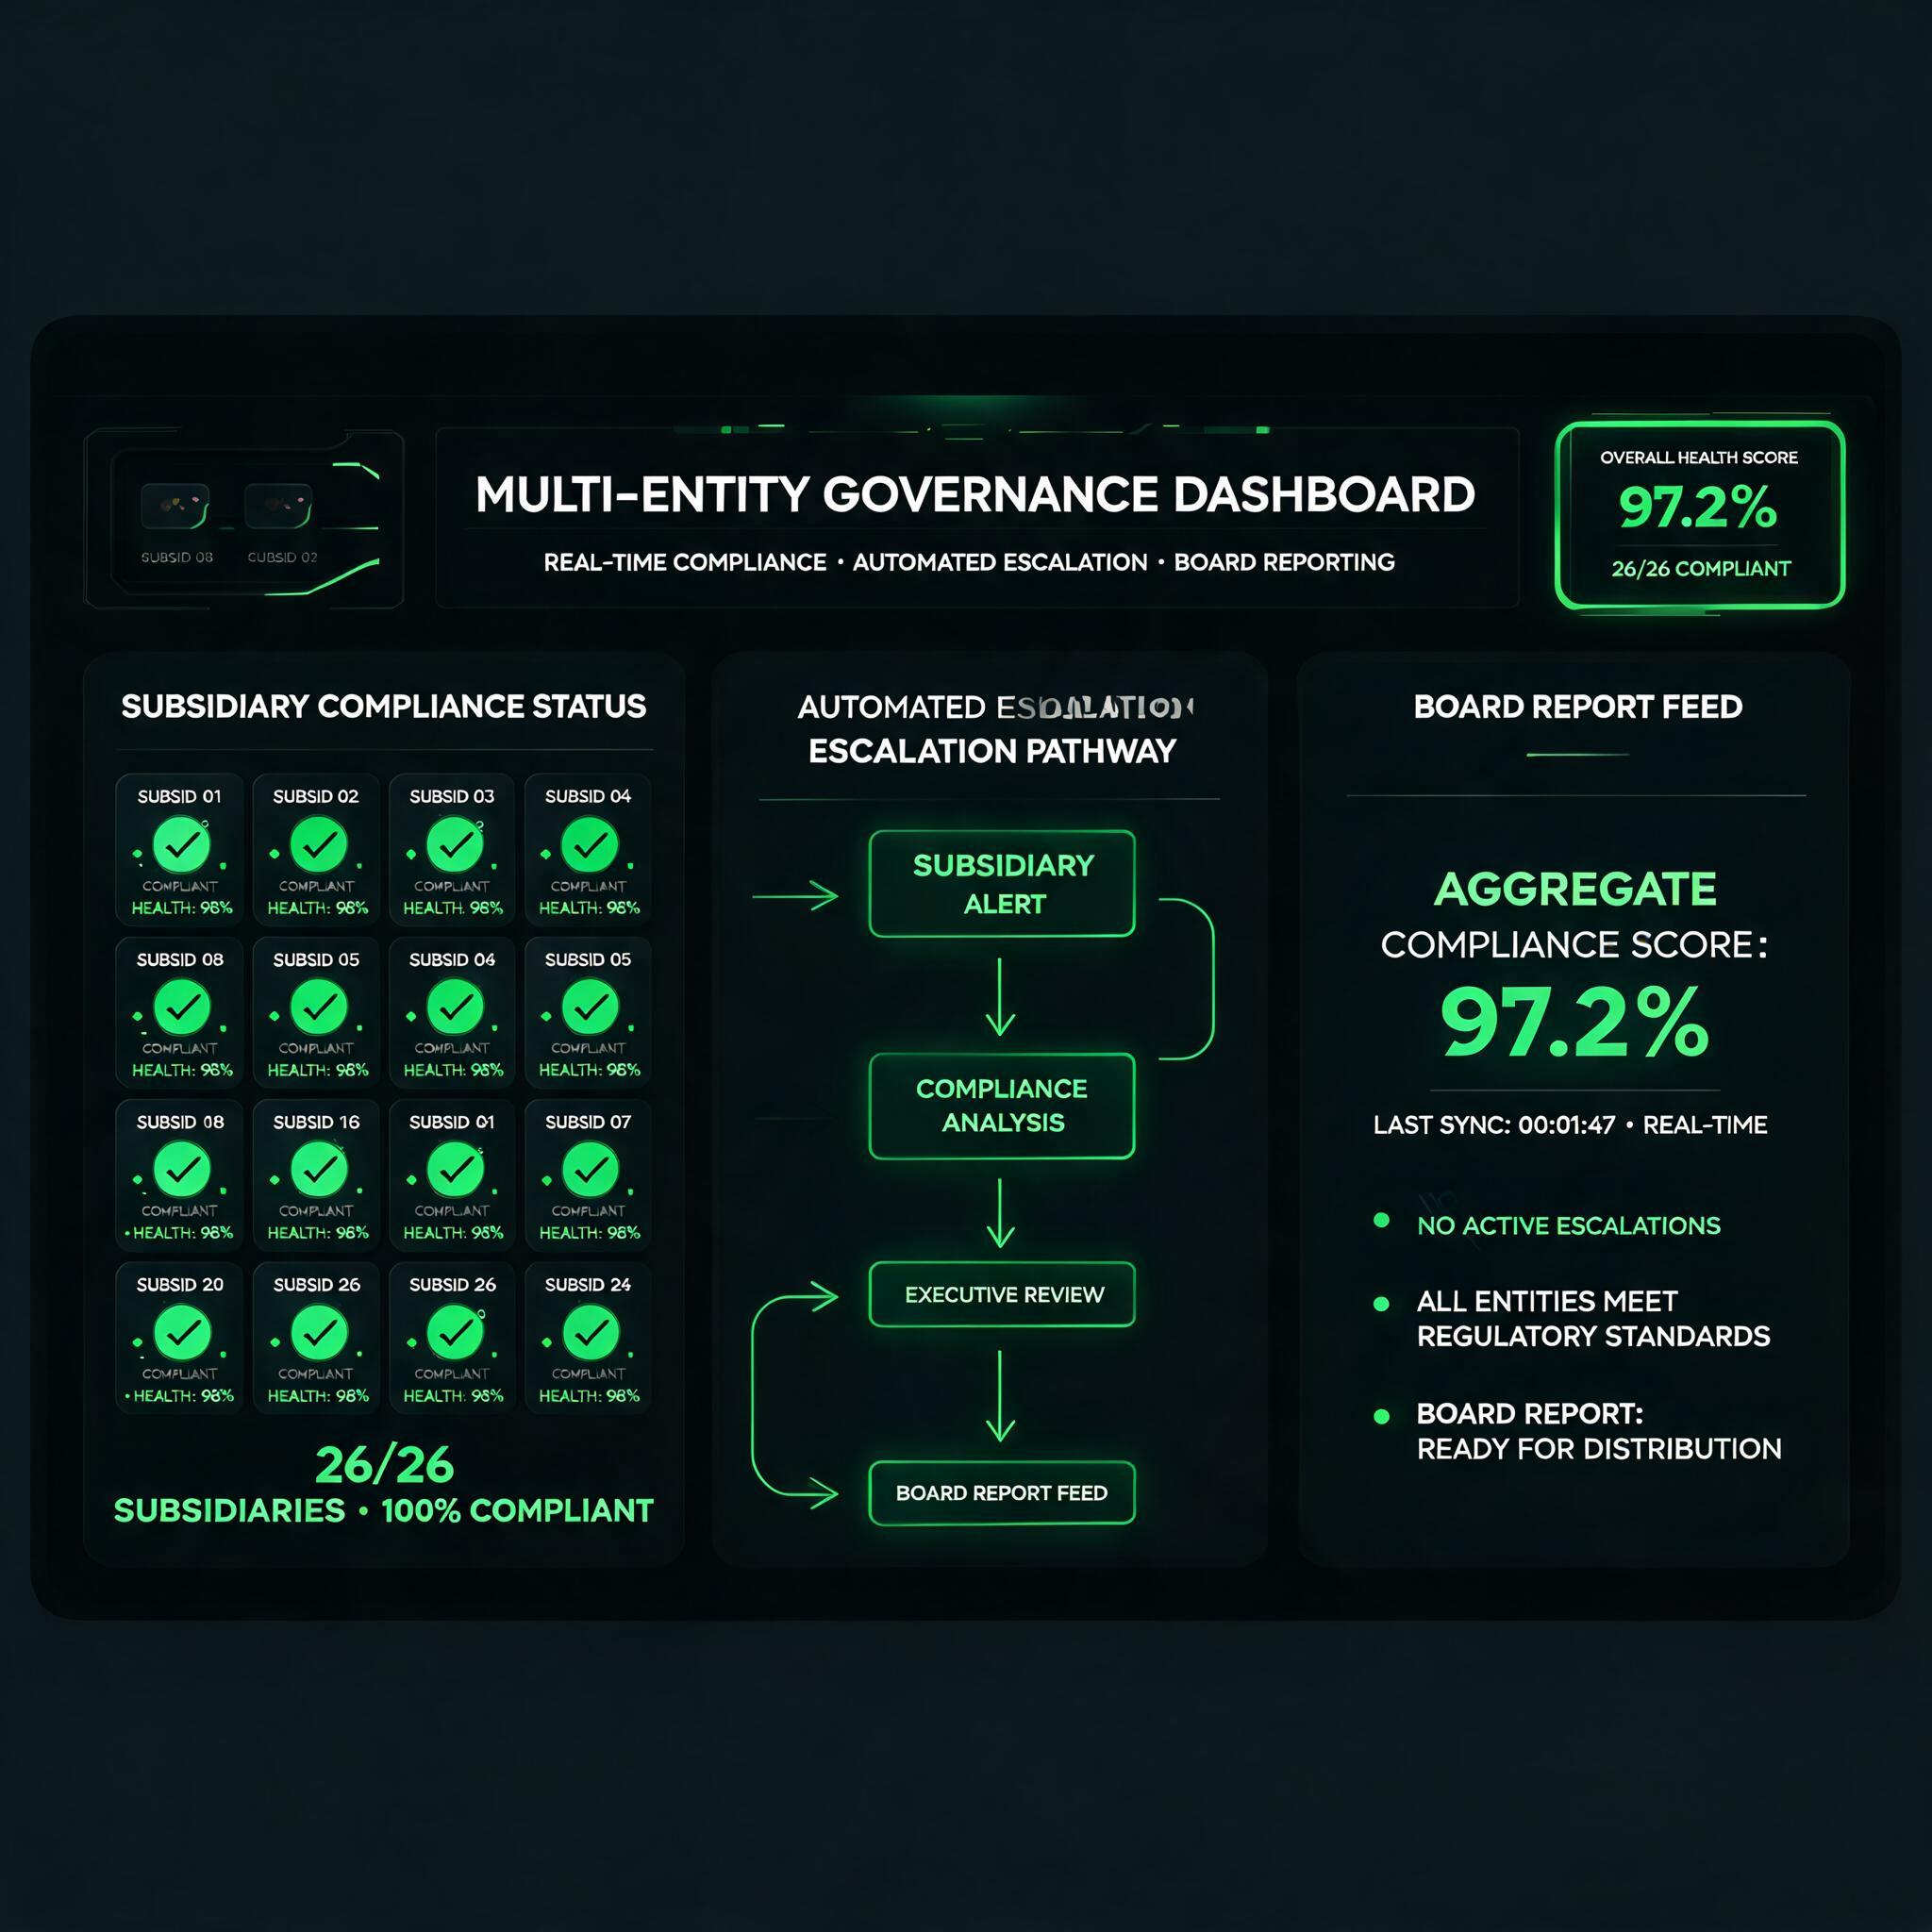
Regulators are increasingly scrutinising board risk reporting quality. The FCA's Dear CEO letters in 2024 and 2025 highlighted concerns about the quality of risk information reaching boards, noting that firms relied on "backward-looking MI" that did not give directors adequate forward-looking risk visibility.
The PRA's supervisory statement SS1/21 on operational resilience requires firms to demonstrate that boards receive adequate information about threats to important business services. This is not a heatmap showing "operational risk: medium." It is specific information about the risks affecting specific business services, the controls protecting them, and the current assessment of their resilience.
The UK Corporate Governance Code (2024 revision) strengthened the board's responsibilities for risk management and internal control, requiring directors to assess the effectiveness of the company's risk management and internal control systems at least annually. Directors cannot discharge this duty by reviewing a heatmap. They need evidence-based reporting that connects risks to controls and shows whether those controls are effective.
Organisations that continue to rely on heatmaps and narrative reports will increasingly find themselves on the wrong side of regulatory expectations. The regulators want evidence of effective board oversight, and evidence requires data, not decoration.
In Simplif-i, the board risk report is generated from the same data platform that manages risks, controls, incidents, projects, and governance actions throughout the year. The board report is a view of that data, not a separate artefact compiled independently.
This means:
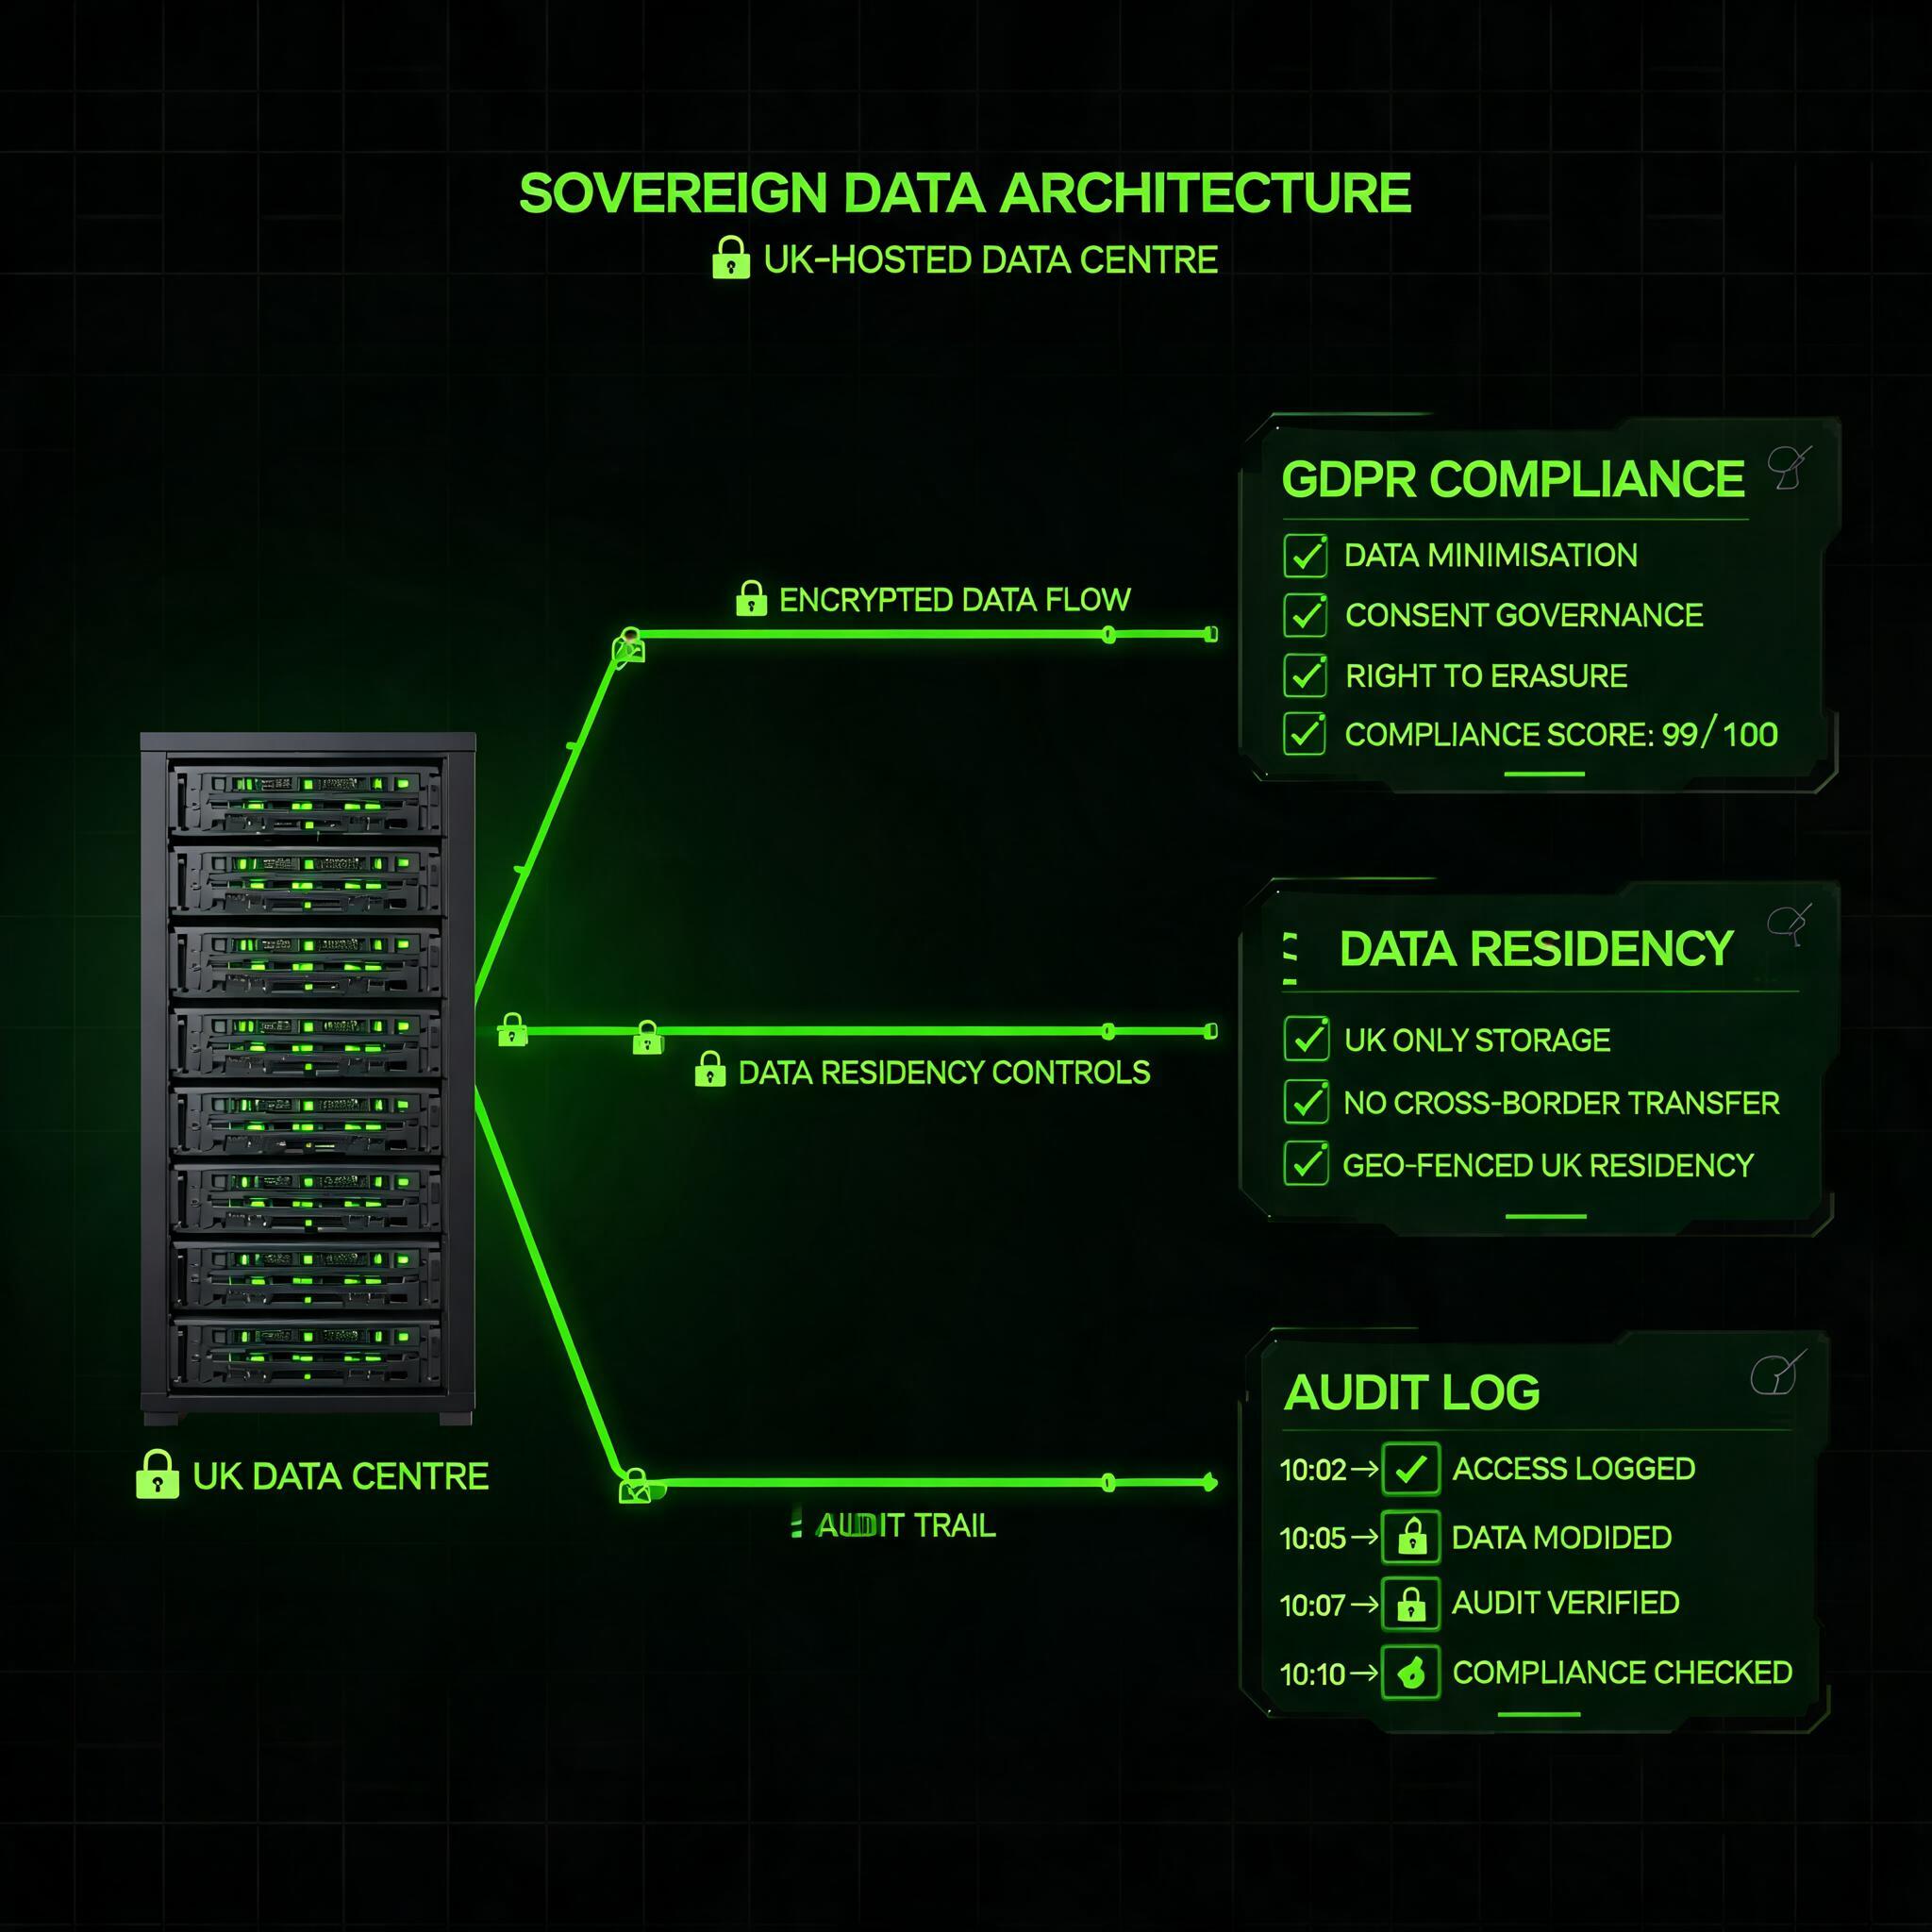
Board risk reports should enable governance, not decorate it. Heatmaps are familiar and visually satisfying, but they fail the basic test of any governance tool: do they give directors the information they need to make decisions?
The shift from heatmaps to governance intelligence is not about more complex charts. It is about better data architecture. Event-driven risk updates. Connected risk and control mapping. Automated reporting from a single platform. Evidence behind every assessment. And risk appetite thresholds that are measured, not guessed.
If your board risk report takes two weeks to compile and looks the same as it did five years ago, you are not doing governance. You are doing theatre.
Compliance, simplif-i'd.
--- Source: https://simplif-i.com/api/blog/readable/grc/board-risk-reporting-heatmaps-governance-intelligence Web Version: https://simplif-i.com/blog/grc/board-risk-reporting-heatmaps-governance-intelligence © Simplif-i - Unified Business Management Platform